Politics | Demographics
REPRESENTING US:
2018 Pre-election content
by APM RESEARCH LAB STAFF | OCT. 9, 2018
On Tuesday, November 6, 2018, the midterm elections will determine the new composition of the U.S. House of Representatives, with all 435 seats up for election. The current House contains 236 Republicans, 193 Democrats, and six vacant seats. Our nonpartisan Representing US project explores the differences across districts—from education and poverty levels, to racial and immigrant make-up, to partisan lean, and more.
With this, our second release of Representing US, we’ve added a series of data about potential voters in our Demographics Tool, but you can also still examine characteristics of all residents. In our Voting Insights Tool, we’ve added candidates appearing on the November ballot, with a special focus on women candidates. Learn about the households that will elect—and be represented by—the new House in our Representing US tools below.
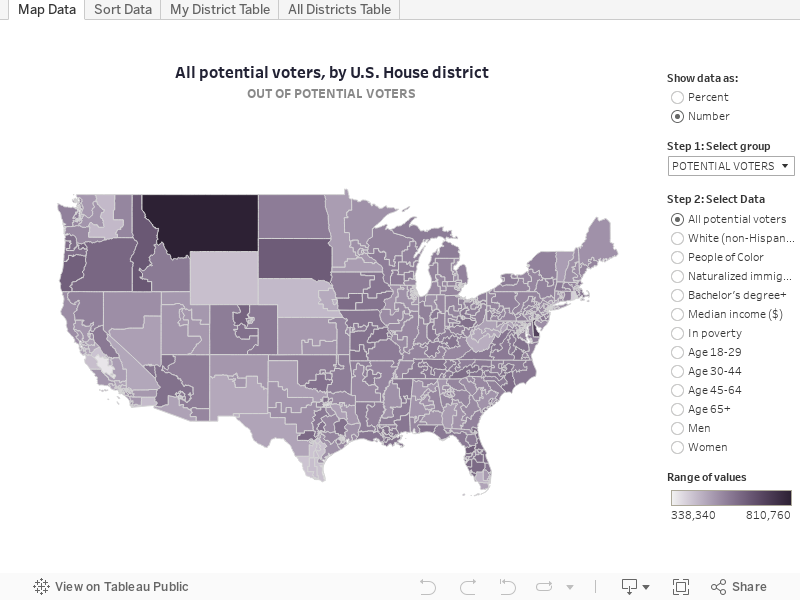
Representing US: Demographics Tool
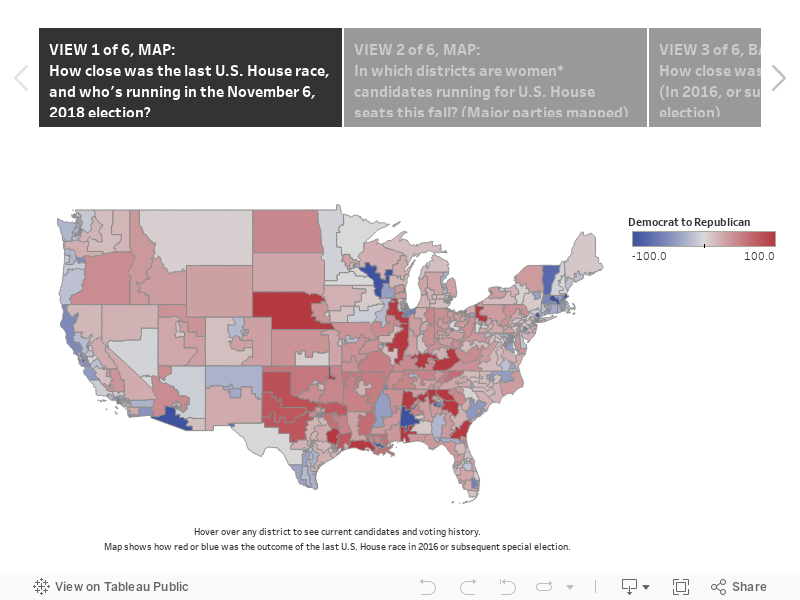
Representing US: Voting Insights Tool
Notes about use
On social media, please use the hashtag #RepresentingUS. Users may freely use data and images from this page. Please include the following citation and link: Source: APM Research Lab, “Representing US, 2018.” Available at: bit.ly/RepresentingUS. If you wish to embed these tools, please contact us at info@apmresearchlab.org. You may still view our first release of Representing US tools in our Tableau gallery.
How to use these tools
Click here to view a video tutorial showing the functionalities of the Demographics and Voting Insights tools.
If map or graph doesn’t generate in the Demographics Tool, be sure you have completed Step 2 at right.
On map views, use + or – (in toolbar along the left side of any map view) or your mouse scroll wheel to zoom in and out. You may also click the magnifying glass icon and enter a location to zoom to it. Use the cross-shaped tool to pan and move about, including locating data for Hawaii or Alaska.
Click the home icon or refresh your browser page to reset the view.
All bar graphs and tables may be sorted (high-to-low, low-to-high, or alphabetically) by clicking the sort icon (three stacked bars).
In all views, additional data appears in the tool-tip, which appears if you rest your mouse over a district in a map, bar in a graph, or cell in a table.
All data in the Demographics Tool may be displayed as a percentage or a number (estimate), by changing the “Show Data As” control at right of each view. Median household income and median age data will only appear if you select “Number.”
Click here if you do not know your U.S. House district to locate it by your zip code, or use the magnifying glass icon on the map views to identify district(s) associated with a zip code, city, state, or other geography.
Data sources and notes
DEMOGRAPHICS TOOL:
All data sourced from the U.S. Census Bureau’s 2017 American Community Survey. Additional calculations by APM Research Lab. Data represent average characteristics during calendar year 2017 (latest).
Data for Pennsylvania do not use the February 2018 district boundaries issued by the Pennsylvania Supreme Court as neither Census nor voting data were available at the time of publication for these geographies.
With the exception of the non-Hispanic White population, all other racial and ethnic groups include multiracial persons. For example, a person self-identifying as both Black and Hispanic would be counted in each group. Therefore, adding the number of people in all race groups will sum to more than the total population. As a confidentiality protection, the U.S. Census Bureau has suppressed the Native Hawaiian population and other small estimates in some districts. They appear as no data in these tools.
“Potential voters” are defined as citizens of voting age (18 or above). We have not made further adjustments for felon status.
Percentages shown for unemployment (rate) use the 16+ civilian labor force as the denominator, and the number of unemployed persons as the numerator.
Margins of error (for a 90% confidence interval) are available in the tool-tip for all data. In the case of APM Research Lab aggregations, we have calculated new margins of error.
VOTING INSIGHTS TOOL:
Candidate names and party affiliation sourced from Ballotpedia. (D) refers to Democrat, (R) refers to Republican, (I) refers to independent, (L) refers to Libertarian, and (G) refers to Green party. All other third party candidates or write-ins are noted as such. In View 2, * refers to candidates identifying as women.
Data on Trump/Clinton margin by U.S. House district sourced from Cook Political Report’s most recent Partisan Voting Index by state and district, which uses data collected by POLIDATA. Further methodology can be found in the full Report by Cook.
Data on U.S. House election results sourced from CNN, Politico, the New York Times and states’ Secretary of State offices. Only the latest election data is shown; therefore, margins of victory in House races reflect special elections where held since 2016.
Data for Pennsylvania do not use the February 2018 district boundaries issued by the Pennsylvania Supreme Court as neither Census nor voting data were available at the time of publication for these geographies.
In some cases, margins of victory may differ slightly from the gap between candidates’ vote shares, due to rounding from figures with greater precision.
Uncontested races as well as same-party races (e.g., Democrat vs. Democrats) are represented as 100% blue or red in Views 1 and 3.
Note: The above data visualizations are the second versions of our Representing US tools, which include updated and expanded data. The first versions of the tools are still available here in our Tableau gallery. The data file associated with the first release is available for download. The demographic, economic, and social data in this file are sourced from the 2016 American Community Survey.
Please email us at info@apmresearchlab.org with any additional questions about these tools.