Divided Decade:
How the housing market changed in the last 10 years

Photo: Tom Rumble via Unsplash
RELATED STORIES
MARKETPLACE: WHY RENTING IS UP AND HOMEOWNERSHIP IS DOWN IN ‘AFFORDABLE’ CLEVELAND
MPR NEWS: HOMEOWNERSHIP RATES IN TWIN CITIES ARE AMONG THE LOWEST IN U.S.
WCPN: A DECADE AFTER GREAT RECESSION, MOST CLEVELAND HOUSEHOLDS RENT
ATLANTA BLACK STAR: GREAT RECESSION TO BLAME FOR FALLING BLACK HOMEOWNERSHIP
by APM RESEARCH LAB STAFF | Feb. 12, 2019
Millions of Americans lost their homes during the Great Recession, as the housing market collapsed, the economy faltered, and many Americans found themselves unable to pay their mortgages. Now, more than 10 years later, we are examining key changes in the housing market: renting rates, affordability challenges, and homeownership opportunities for the nation’s largest cities, coast to coast.
We are releasing a series of data visualization (viz) tools in late 2018 and early 2019 in tandem with our media partner, Marketplace.
Explore all the results in our interactive tools below.
More than half of American renters are burdened by rental costs
Black homeownership falls or stalls nearly everywhere
The rise of renters
More than half of American renters are burdened by rental costs
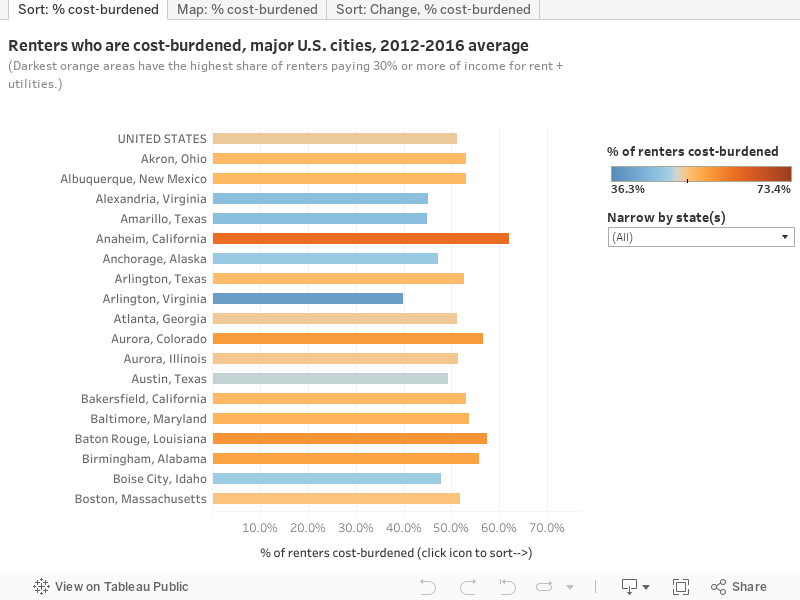
Renting households are considered “cost-burdened” if they are paying 30 percent or more of their income toward rent and utilities. Households who pay above this threshold may sacrifice other areas of their budget—struggling to afford food or medications or making trade-offs such as selecting cheaper child care arrangements. Cost-burdened renters may also be hard-pressed to save a down-payment necessary to move into homeownership, the primary way that Americans build wealth.
Across the United States, just over half (51.1%) of all rental households were cost-burdened (on average) during the five year period ending in 2016. But in many cities, the likelihood of rental costs unduly straining the budget is far higher. The APM Research Lab examined where cost-burdened renting was most common, and also where these burdens had moderated or increased since the Great Recession. Our analysis examined America’s 172 cities with populations of 150,000 or more.
KEY FINDINGS
Which cities have lower rates of cost-burdened renters? (See 1st or 2nd tab in viz)
At 36.3%, renters living in Sunnyvale, Calif. (in Silicon Valley), are the least likely to be cost-burdened of any major U.S. city. Among renters there the median, or typical, household income exceeds $100,000. Other relatively wealthy rental communities are among the top 10 cities with the lowest rates of burdened renters, including Arlington, Va. (39.8% cost-burdened) and Fremont, Calif. (40.9%). In these communities, the high incomes of many renters moderate the burden imposed by high housing costs.
However, some less wealthy areas are also kinder to the budgets of their renting households. They include Cary, N.C. (37.1% cost-burdened); Overland Park, Kan. (38.9%); and Irving, Tex. (39.8%). The median income of all renting households in these communities is less than $60,000. However, more modest housing costs in these places keep cost-burdens from falling on fewer than 4 in 10 renters.
Which cities have the highest rates of cost-burdened renters? (See 1st or 2nd tab in viz)
Seventy-three out of 100 renting households in Hialeah, Fla., are paying more than 30 percent of their income toward rent and utility costs, leading all U.S. major cities in cost-burdened likelihood. (The median income of all renters in Hialeah is $23,100 annually.) Renters in Palmdale, Calif. (67.4% cost-burdened) and Miami, Fla. (66.4%) are next in line for renters paying “too much” to secure their housing. Among the 15 cities with the greatest share of renters who are cost-burdened, 11 are located in California.
Where has the likelihood of being cost-burdened increased or decreased for renters since the Great Recession? (See 3rd tab in viz)
The five California cities of Santa Ana, Ontario, Corona, Irvine, and Sunnyvale experienced the greatest rise in share of cost-burdened renters since the Great Recession—a gain of 4 to 6.5 percentage points. Springfield, Mass.; Alexandria, Va.; Albequerque, N.M.; Brownsville, Texas; and Lakewood Colo.; are also among the major U.S. cities that also saw growing levels of cost-burdened households among their renters. Each saw the cost-burdened share tick up by 3.5-4 percentage points between the two periods of 2007-11 and 2012-16.
Eight cities saw their share of cost-burdened renters decrease by 5 or more percentage points between the two periods—i.e., renting was affordable for more households. They include Elk Grove, Calif.; Corpus Christi, Texas; Cape Coral, Fla.; McKinney, Texas; Akron, Ohio; Little Rock, Ark.; and Peoria and Scottsdale, Ariz.
Black homeownership falls or stalls nearly everywhere
RELATED STORIES
MPR NEWS: HOMEOWNERSHIP RATES IN TWIN CITIES ARE AMONG THE LOWEST IN U.S.
MARKETPLACE: CLOSING THE HOMEOWNERSHIP GAP IN HOUSTON AND BEYOND
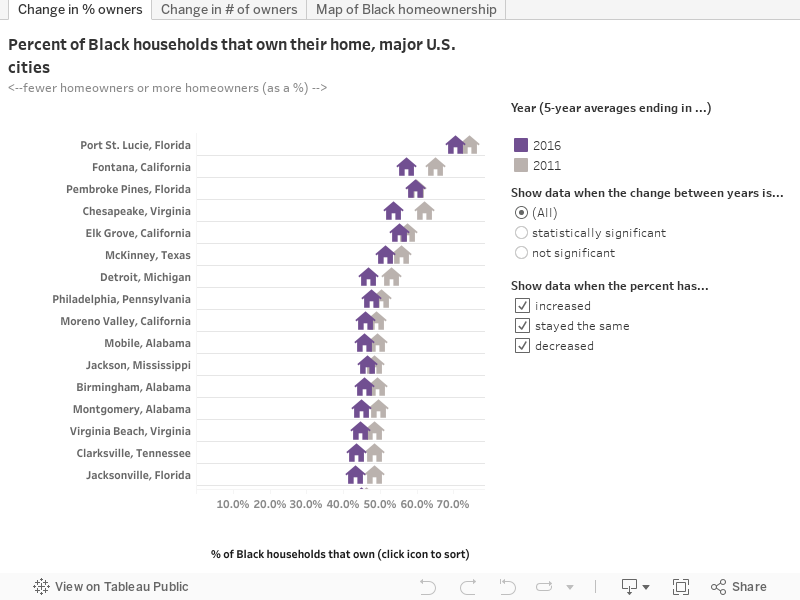
One of the many painful consequences of the Great Recession was the wide-scale erosion of homeownership, and Black Americans were the hardest hit. According to the Joint Center for Housing Studies and reported by NPR, Black Americans’ rate of owning homes had been rising throughout the 1990s and early 2000s, but fell between 2004 and 2016. As the Urban Institute has noted, “all of the gains in Black homeownership since the Fair Housing Act [of 1968] have been erased since 2000.” Just over 4 in 10 Black households own their home, compared to more than 7 in 10 White households.
While this characterizes the national picture, APM Research Lab sought to discover whether Black residents had made home-owning gains in any major cities across the U.S. in the years since the Great Recession. Our analysis examined America’s 128 cities with populations of 150,000 or more that also had a minimum of 5,000 Black households. In 79 cities and the U.S. as a whole, Black homeownership eroded and Black households swelled the rental market.
KEY FINDINGS
Which cities have higher and lower rates of Black homeownership? (See 1st tab in viz)
Black Americans are most likely to be homeowners in a handful of modest-sized cities that have relatively few black households, including Florida cities Port St. Lucie (70.7%) and Pembroke Pines (59.6%), and California cities Fontana (57.4%) and Elk Grove (55.3%). Chesapeake, Va. (53.8%) and McKinney, Texas (51.6%) are the only other cities where more than half of Black households own their homes.
However, homeownership rates are also higher in select communities where the Black population has a much a larger presence: Birmingham (45.7%), Montgomery (45.1%), and Mobile (45.9%), Ala.; Jackson, Miss. (46.7%); and Detroit, Mich. (46.8%). Among cities with more than 1 million residents, Black homeowning rates are highest in Philadelphia, Penns. (47.8%) and lowest in New York City (26.5%).
Has homeowning among Black households been increasing or decreasing in 128 major U.S. cities in the past decade? (See 2nd tab in viz)
In 79 cities and the U.S. as a whole, Black homeownership eroded. (Forty other cities had what appeared to be declines but they are not statistically significant. An additional eight cities had rates that were unchanged or appeared to increase, but the change was also not significant.)
Have the numbers of Black homeowning households increased or decreased in 128 major U.S. cities? (See 3rd tab in viz)
Only four cities—Pasadena, Texas; Henderson, Nev.; McKinney, Texas; and New Orleans, La.—saw a statistically significant increase in the number of Black homeowners over the last decade. With the exception of New Orleans, none of the other cities has even 5,000 Black owner households yet. New Orleans added about 3,100 Black owner households, and now has just over 36,000 total Black households who own their home, rather than rent. On the other hand, 57 cities and the U.S. overall saw significant losses in the number of Black owner households. (An additional 47 saw declines in the data, but are not significant, and 20 saw increases that were also not significant.)
The rise of renters
RELATED STORIES
MARKETPLACE: THE RISE OF RENTERS
DIVIDED DECADE: HOW THE FINANCIAL CRISIS CHANGED THE HOUSING MARKET
The Great Recession pushed millions of former American homeowners into the rental market. Since then, tighter credit conditions, low housing supply, and personal financial challenges have also put homeownership out of reach for many. Nationally, the percent of households who rent increased 4.2 percentage points from 2006 to 2016, representing an increase of 7.3 million renting households.
The APM Research Lab sought to discover whether renting rates had decreased in any major U.S. in the years since the Great Recession—countering the national trends. Our analysis examined America’s 172 cities with populations of 150,000 or more. Not a single city saw a (statistically significant) decline in the percent of households that rent, and many saw substantial increases.
EXPLORE THE TRENDS FOR ALL MAJOR CITIES IN THE INTERACTIVE VISUALIZATION BELOW

KEY FINDINGS
Among major cities not a single city saw a (statistically significant) decline in the percentage of households that rent, and many saw substantial increases. Lancaster, Calif., saw the biggest increase in its share of renters between 2006 and 2016, rising by 15.3 percentage points to 51.9 percent, while cities like Brownsville, Texas, and Anchorage, Alaska, saw no significant increase. (See 1st, 2nd, and 3rd tabs in viz).
Renting is generally more common in coastal cities in New Jersey, New York, California and Florida. However, some more inland cities also have high rates of renting—for example, Cincinnati, Ohio (62.0%); Milwaukee, Wisc. (59.2%); and Irving (61.7%) and Dallas (59.2%), Texas in the latest data. Newark, N.J., had the highest proportion of renters in 2016, at 79.1 percent, followed by Jersey City, N.J (73.3%), Miami, Fla. (69.9%), New York City, N.Y. (68.0%), and Providence, R.I. (66.9%). (See 4th tab in viz).
Households were least like to be renters in Frisco, Texas (25.1%), followed by Elk Grove, Calif. (26.4%), and Cape Coral, Fla. and Cary, N.C. (both 28.3%). (See 4th tab in viz).