
RELATED STORIES
REPRESENTING US: Which House members support impeachment?
REPRESENTING US: Home page
LAB NOTES: The unequal counties of America
by ANDI EGBERT and GABRIEL CORTES | Oct. 31, 2019
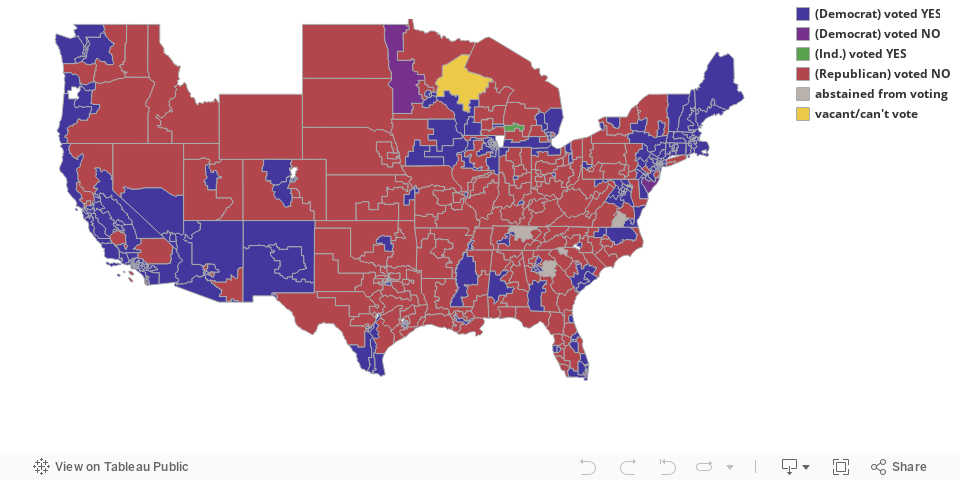
The House of Representatives formalized the next steps in the impeachment inquiry into President Donald Trump Thursday in a vote that fell almost completely on party lines. Nearly every House Democrat voted to move the inquiry forward: Reps. Collin Peterson (D-Minn.) and Jeff Van Drew (D-NJ) were the only Democrats who broke with their caucus to vote against the measure.
On the other side of the aisle, GOP lawmakers were similarly united: All the Republican House members who cast ballots voted against the measure.
The resolution passed 232 to 196.
The House is now one step closer to drawing formal articles of impeachment against the president, and it gives Democrats greater leverage in their ongoing investigations into the White House’s conduct toward Ukraine.
The vote came only a month after Nancy Pelosi announced that she supported opening the inquiry. After that, relevant House committees quickly began deposing various White House and State Department officials in private. This new resolution sets the stage so that public hearings can begin.
Explore the map below to learn more about each representative’s district and how he or she voted.
The House vote to formalize the impeachment inquiry
Collin Peterson and Jeff Van Drew: Two Democrats in Trump-leaning districts

Collin Peterson represents Minnesota’s 7th District.
Photo: the U.S. Department of Agriculture via Flickr
Collin Peterson of Minnesota and Jeff Van Drew of New Jersey were stand-outs in Thursday’s vote: They were the only Democrats to vote against formalizing the impeachment inquiry.
Peterson has represented his largely agricultural district in western Minnesota since the early 1990s. The district itself trends conservative, and, in 2016, it voted overwhelmingly for Donald Trump over Hillary Clinton.
RELATED CONTENT: Where do members of Minnesota’s congressional delegation stand on impeachment? (MPR News)
Election results from Minnesota's 7th District in 2016 and 2018
Percentage of the vote
Van Drew, by contrast, was elected to Congress in the 2018 midterm elections after Republican Congressman Frank Lobiondo retired from the House; Lobiondo had represented that district for more than 20 years.
The district leans conservative, and Trump won it by more than four points in 2016. However, Van Drew turned the seat from red to blue during 2018’s blue wave election year, beating his Republican opponent by more than seven points.
Election results from New Jersey's 2nd District in 2016 and 2018
Percentage of the Vote
In addition to Peterson and Van Drew breaking with their caucus, one other Democrat—William Timmons of South Carolina—abstained from the vote. Three Republicans—John Rose of Tennessee, Jody Hice of Georgia and Donald McEachin of Virginia—did not cast ballots.
Which other House Democrats represent Trump districts?
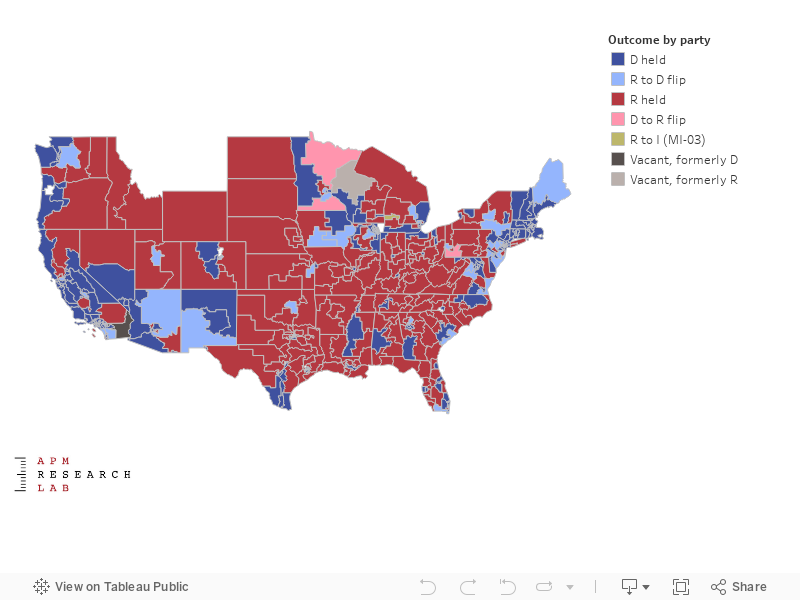
Van Drew was just one of more than 40 Democratic House lawmakers who won their seats in 2018 and turned that chamber from red to blue. Hover over each district on the map below to see which other House districts flipped party control.
And explore the margins of victory for each house race in the interactive graph below.
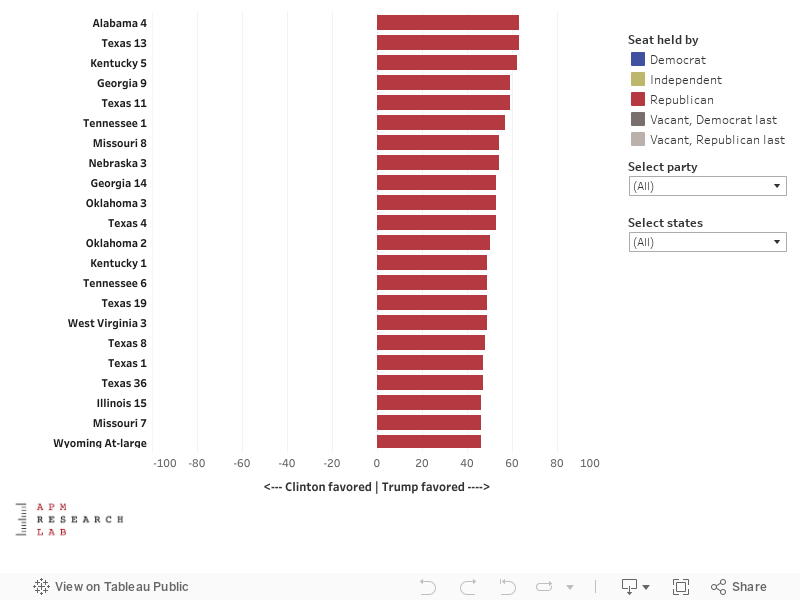
Finally, check out what each district’s support was for either Hillary Clinton or Donald Trump in the 2016 presidential election.
Thoughts? Questions?
We want to hear from you! Leave us a message below.
…or email us at info@apmresearchlab.org
Notes about use
Users may freely content from this page. Please include the following citation and link. Source: APM Research Lab, Representing US, 2019. Available at: apmresearchlab.org/representingus. On social media, please use the hashtag #RepresentingUS.
You may also wish to see our 2018 Midterms’ outcomes in our Representing US interactive tools or our pre-election content including candidate data and demographic and economic data by district. Please email us at info@apmresearchlab.org with any additional questions.
How to navigate these tools
On map views, use + or – (in the toolbar along the left side of any map view) or your mouse scroll wheel to zoom in and out. You may also click the magnifying glass icon and enter a location to zoom to it. Use the cross-shaped tool to pan and move about, including locating data for Hawaii or Alaska.
Click the home icon or refresh your browser page to reset the view. All bar graphs and tables may be sorted (high-to-low, low-to-high, or alphabetically) by clicking the sort icon (three stacked bars).
Click here if you do not know your U.S. House district to locate it by your zip code, or use the magnifying glass icon on the map views to identify district(s) associated with a zip code, city, state, or other geography.
Data sources and notes
Impeachment inquiry vote tallies and the 2018 election results were sourced from the New York Times. (D) refers to Democrat, (R) refers to Republican, (I) refers to independent, (L) refers to Libertarian, and (G) refers to the Green party.
In the case of formerly vacant U.S. House seats, the party which last held the seat is used to determine who held or flipped the seat for the map titled “Which U.S. House seats were held or flipped by each party?”
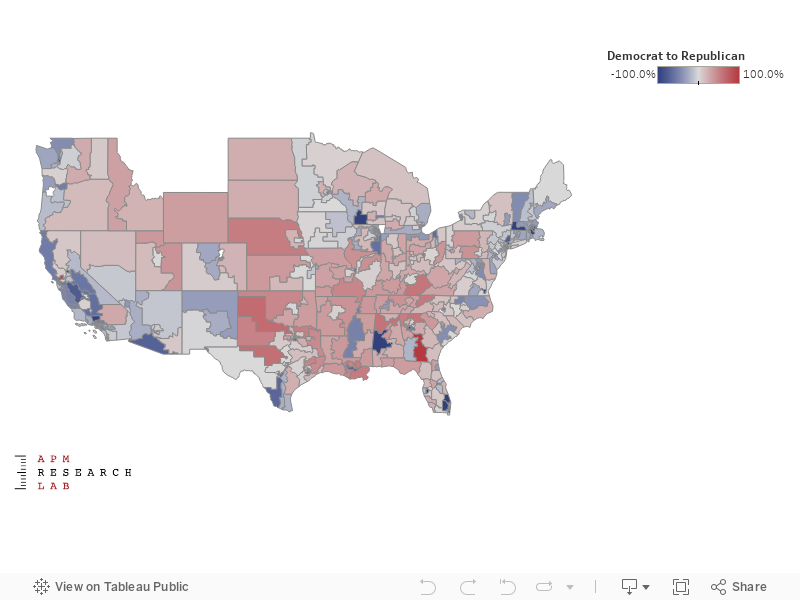
Uncontested 2018 races as well as same-party races (e.g., Democrat vs. Democrats) are represented as 100% blue or red in the margin of victory map. In the case of a Democrat or Republican defeating a third party candidate, the respective margin of victory is shown as a percentage red or blue in the latter map.
Data on Trump/Clinton margin in 2016 by U.S. House district sourced from Cook Political Report’s Partisan Voting Index by state and district, which uses data collected by POLIDATA. Further methodology can be found in the full Report by Cook. Data on 2016 U.S. House election results (and subsequent special elections) sourced from CNN, Politico, the New York Times, and states’ Secretary of State offices.
In some cases, margins of victory may differ slightly from the gap between candidates’ vote shares, due to rounding from figures with greater precision.