Immigrant voters could decide this election

Photo: Elias Castillo via Unsplash
Immigrant voters could decide this election
by ANDI EGBERT | Sept. 15, 2020
Nearly every day now, we are served up new political polls or analyses that plumb broad characteristics—race and education primarily—to assess how each group is likely to vote in the 2020 general election.
But one demographic we know little about is immigrant voters: How do they differ across the map? Where did they come from prior to becoming naturalized U.S. citizens? And how much power do they wield to alter the outcomes this fall?
With immigrants now representing nearly 10% of all eligible voters, candidates and campaigns would be wise to know who these voters are and to tailor their messages to them. Numbering more than 22 million voters in total, immigrant voters who choose to cast ballots could decide U.S. House and Senate races as well as which presidential candidate captures electoral votes in many battleground states.
It’s worth noting that in the 13 battleground states that President Trump won or lost by five percentage points or less in 2016, immigrants now make up a higher proportion of potential voters than his margin was—in every state but Maine. In other words, immigrant votes could decide this election.
Nationwide, 1 in every 66 potential voters is a Mexican immigrant.
On Oct. 2, the cost of taking a citizenship test is set to jump roughly 80%, on top of delays that have stretched into years for some would-be new voters. Regardless whether this was intended, the consequence of both actions will be to prevent otherwise eligible immigrants from acquiring the power to vote in the November election. But sizable numbers already have secured that privilege.
The map below shows the share of the electorate that immigrants represent in each state. California leads the nation, with immigrants representing 21% of eligible voters—or more than twice the national rate.
IMMIGRANTS AS A PERCENTAGE OF ALL POTENTIAL VOTERS, BY STATE
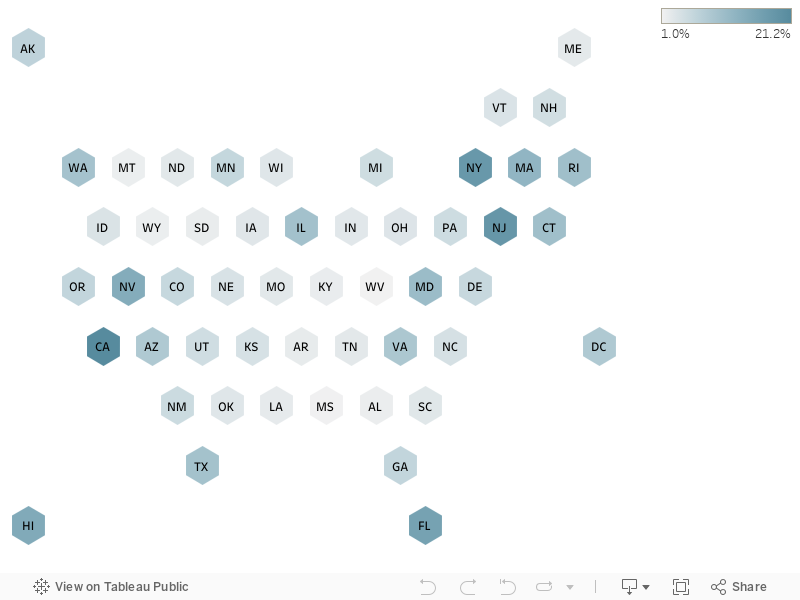
Source: APM Research Lab analysis of IPUMS 2018 American Community Survey. Data have been rounded to the nearest thousand. Error margins exist around these estimates but are not shown.
Three countries account for one-third of all eligible immigrants
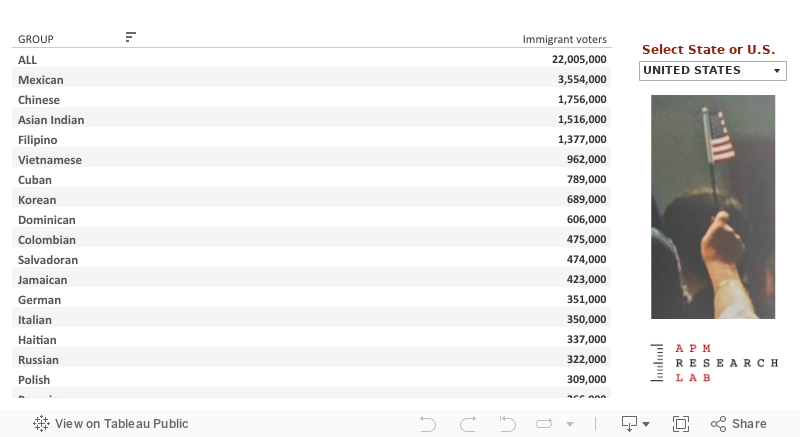
Nationwide, immigrants from India, China and Mexico hold the most voting power—representing nearly one-third of all possible immigrant voters. Numbering 3.55 million, Mexicans who have become naturalized citizens are far and away the largest group of immigrant voters in the United States, and in 25 states as well. Nationwide, 1 in every 66 possible voters is a Mexican immigrant.
10 LARGEST IMMIGRANT GROUPS IN THE U.S., BY NUMBER OF POTENTIAL VOTERS
The size and background of immigrant voters depends a great deal on where you are.
WHERE IS THE DATA FROM?
This analysis leverages the detailed heritage groups that APM Research developed for our Roots Beyond Race project. I examined the share of each of those groups that is both 18 or older and a naturalized citizen in the latest available Census data.
Across the country, the origins of immigrants with the power to vote varies considerably. In Florida, the largest group able to cast a ballot are Cubans (about 608,000 voters). In Louisiana it’s Vietnamese immigrants (about 11,000 voters) and in Connecticut, it’s Asian Indians (24,000 voters). Naturalized Filipinos top all other groups in Alaska (with 8,000 voters), while in Rhode Island, the 15,000 Dominican voters account for the most political heft. Explore the table below to see the estimated number of potential voters who are immigrants by state, sorted from largest to smallest group.
POTENTIAL IMMIGRANT VOTERS BY STATE AND ACROSS THE U.S.
Source: APM Research Lab analysis of IPUMS 2018 American Community Survey. Notes: Groups totaling 20,000 or more voters nationally are included. Data have been rounded to the nearest thousand. Error margins exist around these estimates but are not shown.
What do we know about immigrant voting patterns?
Immigrants of color have outvoted their native-born peers in the past two election cycles.
In the 2018 midterms, Latinos who were naturalized citizens outvoted U.S.-born Latinos by 5 percentage points. Foreign-born Asians and foreign-born Blacks also slightly outvoted their native-born peers. But among White immigrants, those born on American soil were more likely to participate in the election. During the 2016 general election, Black, Latino and Asian immigrants who acquired the right to vote were also more likely cast a ballot than those of the same race whose vote was their birthright.
A hallmark of the Trump Administration has been seeking to choke off the number of immigrants arriving in the U.S. through various pathways—reducing refugee arrivals to historic lows, sharply curtailing employment visas, adopting a “zero tolerance” policy that criminalizes and separates families seeking asylum, and implementing and expanding the travel ban, among other actions. The number of immigrants arriving in the U.S. through legal channels is estimated to be roughly cut in half between federal fiscal year 2016 and 2021, before it closes.
Perhaps that’s not surprising given that immigrants are far more likely to vote Democratic: 2016 exit polls indicated they were more likely to darken the circle for Hilary Clinton over Donald Trump, 2-to-1.
Voters will soon have the opportunity to express their opinions on these policies. Immigration was named a “very important” voting issue by more than half of those registered to vote in 2020, with Trump supporters more likely to say this than Biden supporters. However, more than 22 million immigrant voters—whose very lives have been shaped in some way by U.S. immigration policy—will have the opportunity to make their voices heard this November as well.
-Andi (On Twitter: @dataANDInfo)